Projected heat exposure for elderly populations in Southwestern Europe under future climate scenarios
March 29, 2026
August 2025 was the third-warmest August on record globally, and Heatwaves are becoming increasingly frequent and intense in Southwestern Europe [1]. Using NASA/NEX-GDDP climate models (MIROC5, GFDL-CM3, HadGEM2-ES) and EUROSTAT demographic projections [2, 3], I analyzed the future exposure of elderly populations in Portugal, Spain, and France to summer heat under different climate scenarios (current, RCP4.5, and RCP8.5).
In Google Earth Engine, I calculated mean summer temperatures for the three countries and aggregated the data at NUTS3 level (sub-regional administrative units in the EU) using zonal statistics. The baseline period is 1995–2014, while future climate projections represent average conditions for the mid-century period (2041–2060). Outputs were exported for further analysis in R (sf, dplyr, ggplot2) and prepared for mapping in QGIS.
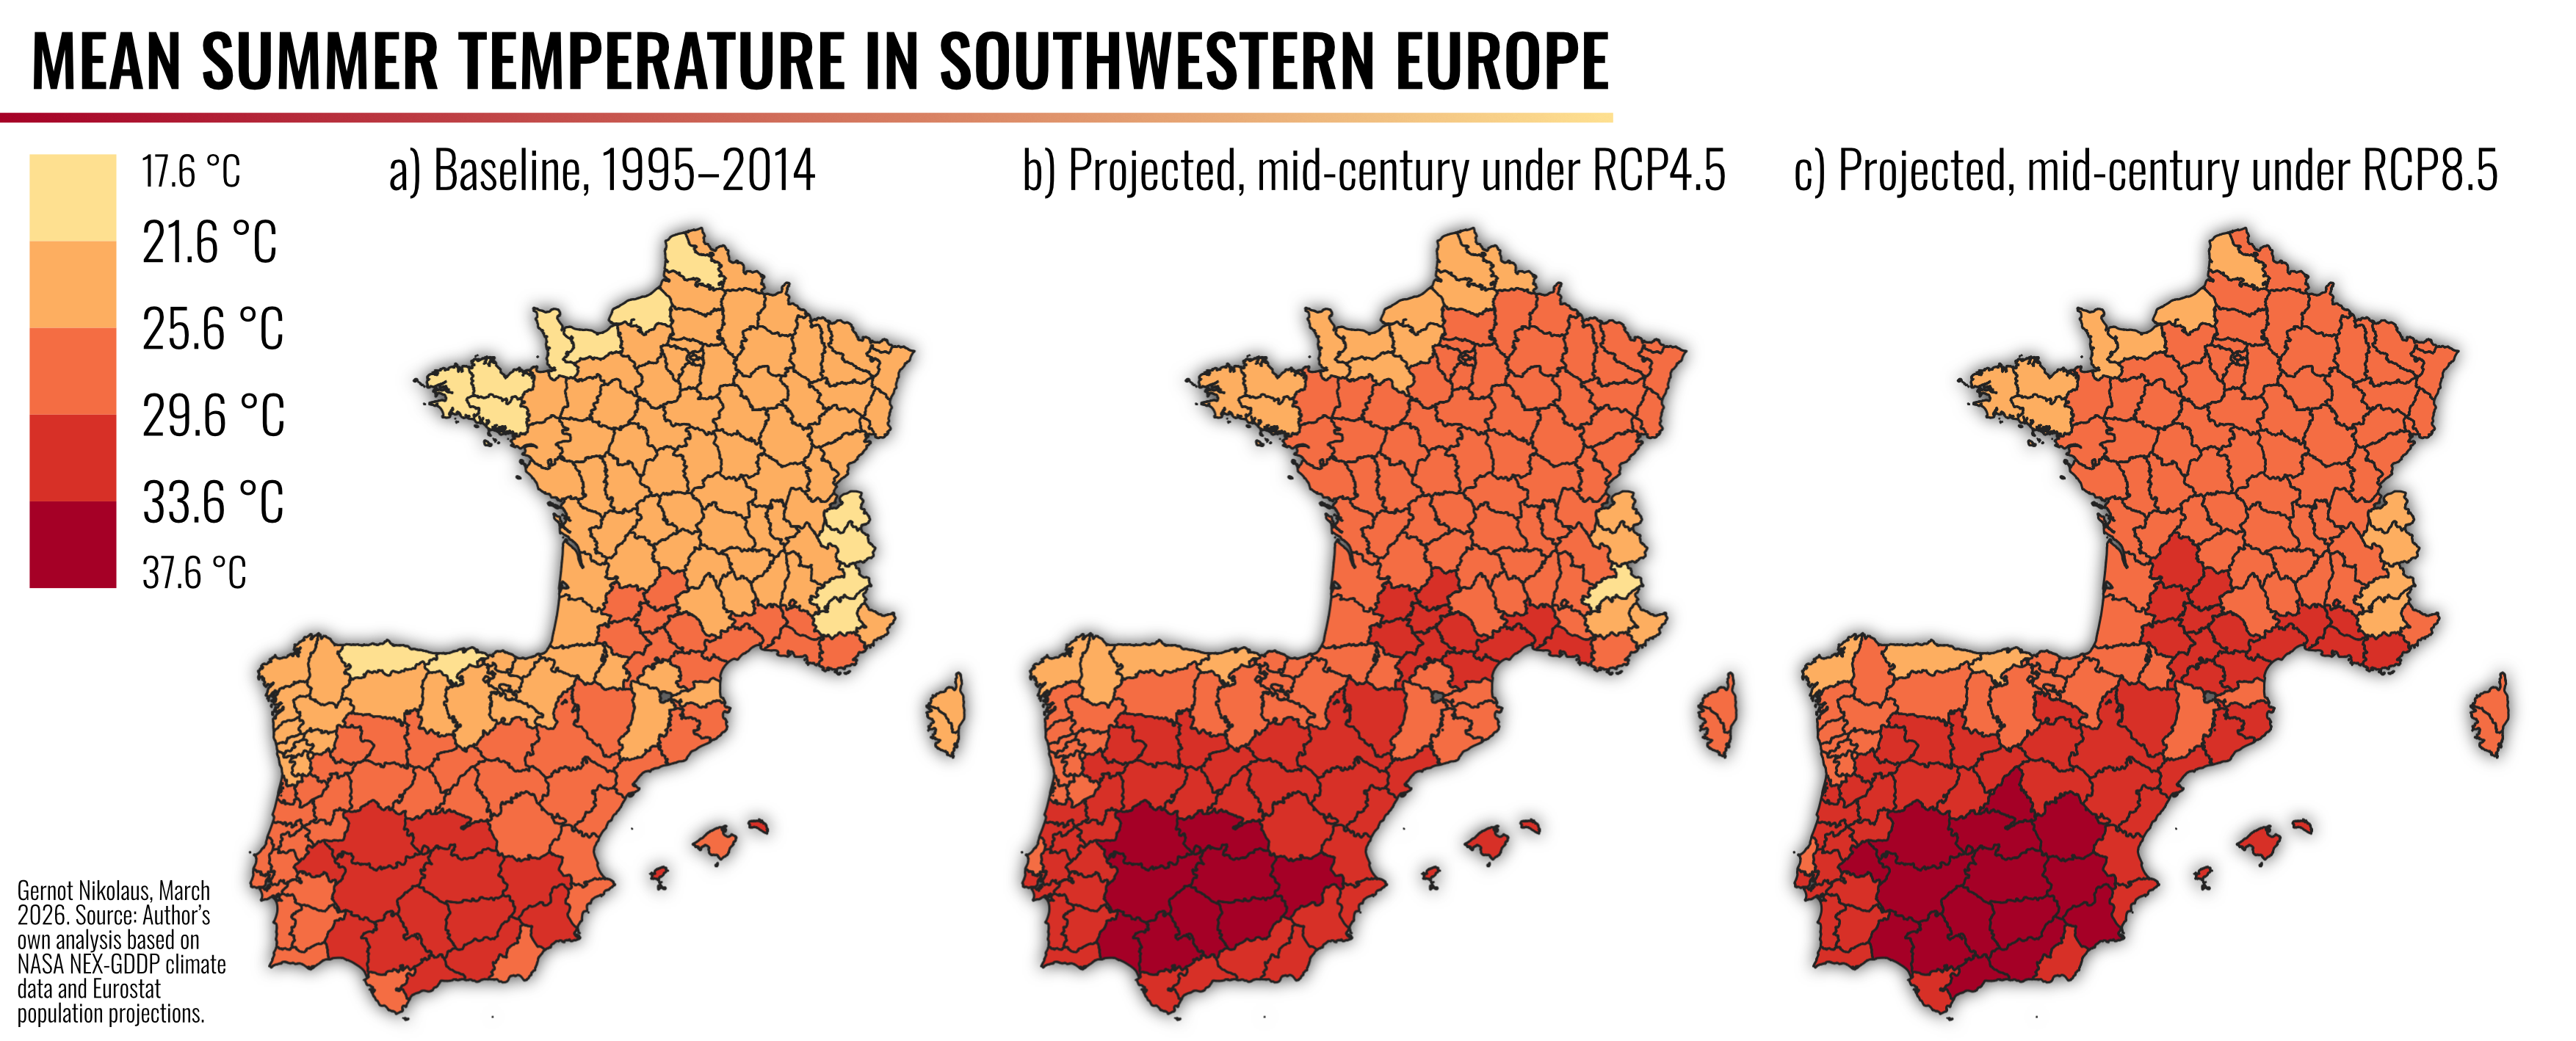
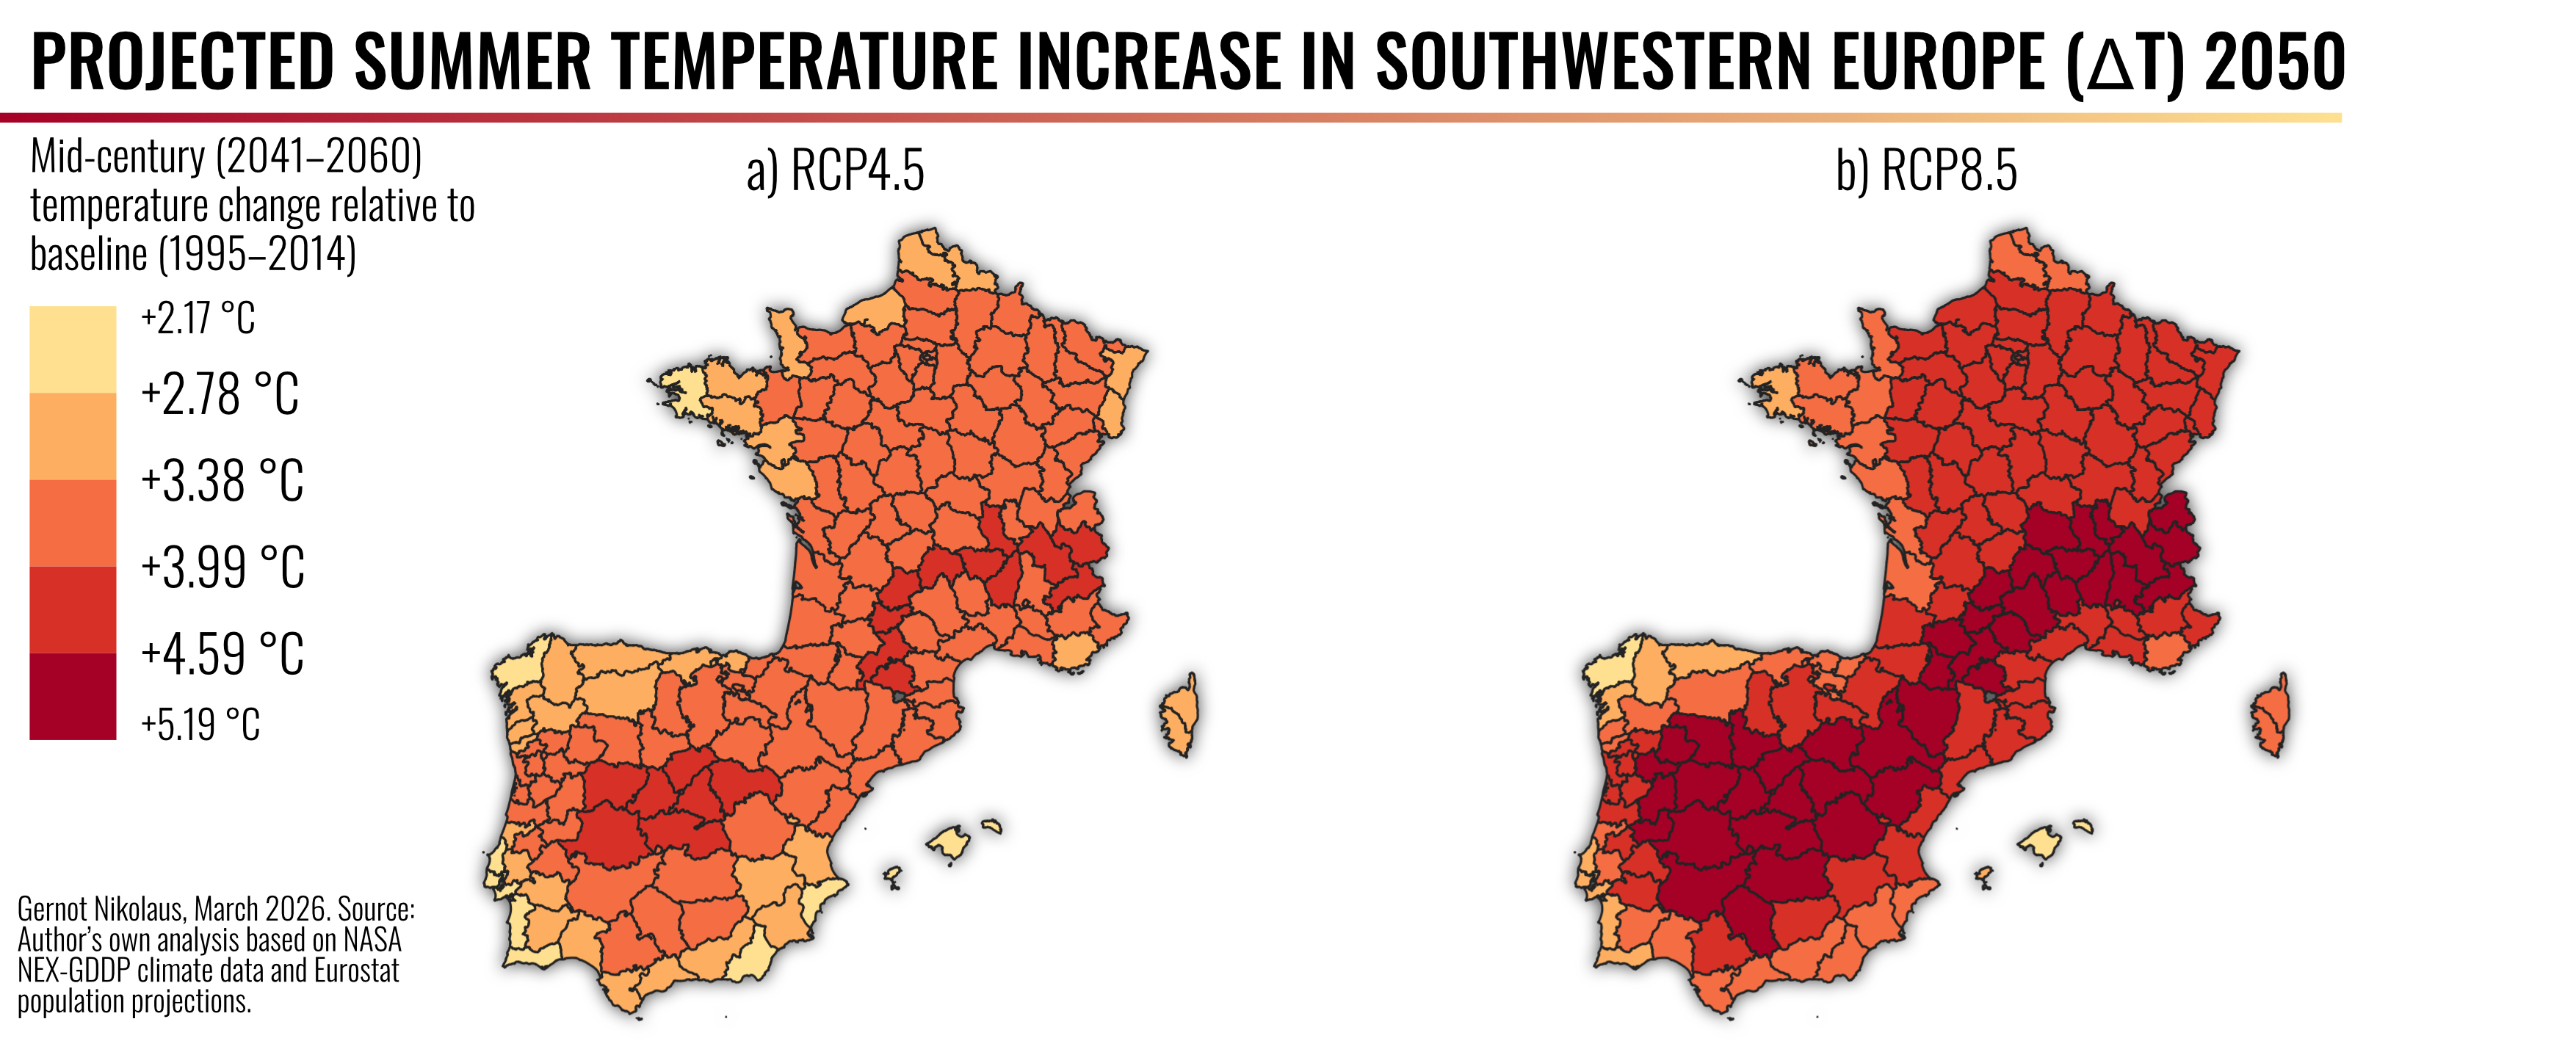
Figure 1 shows the distribution of summer temperatures in Southwestern Europe. While Portugal and especially Spain already have the highest baseline temperatures, these regions are projected to experience the largest increases. Southern and inland Spain (e.g., Córdoba, Sevilla, Ciudad Real, Badajoz) are expected to reach mean summer temperatures of 36–37°C (Table 1), with temperature increases up to 5°C (Figure 2 and 3) in RCP8.5. Portugal’s Alentejo region will also warm significantly (~33–34°C). While France experiences lower absolute temperatures (~28–31°C), projected warming remains substantial.
The density plots represent the distribution of values across all NUTS3 regions, where higher peaks indicate that more regions fall within a specific temperature or elderly share range.
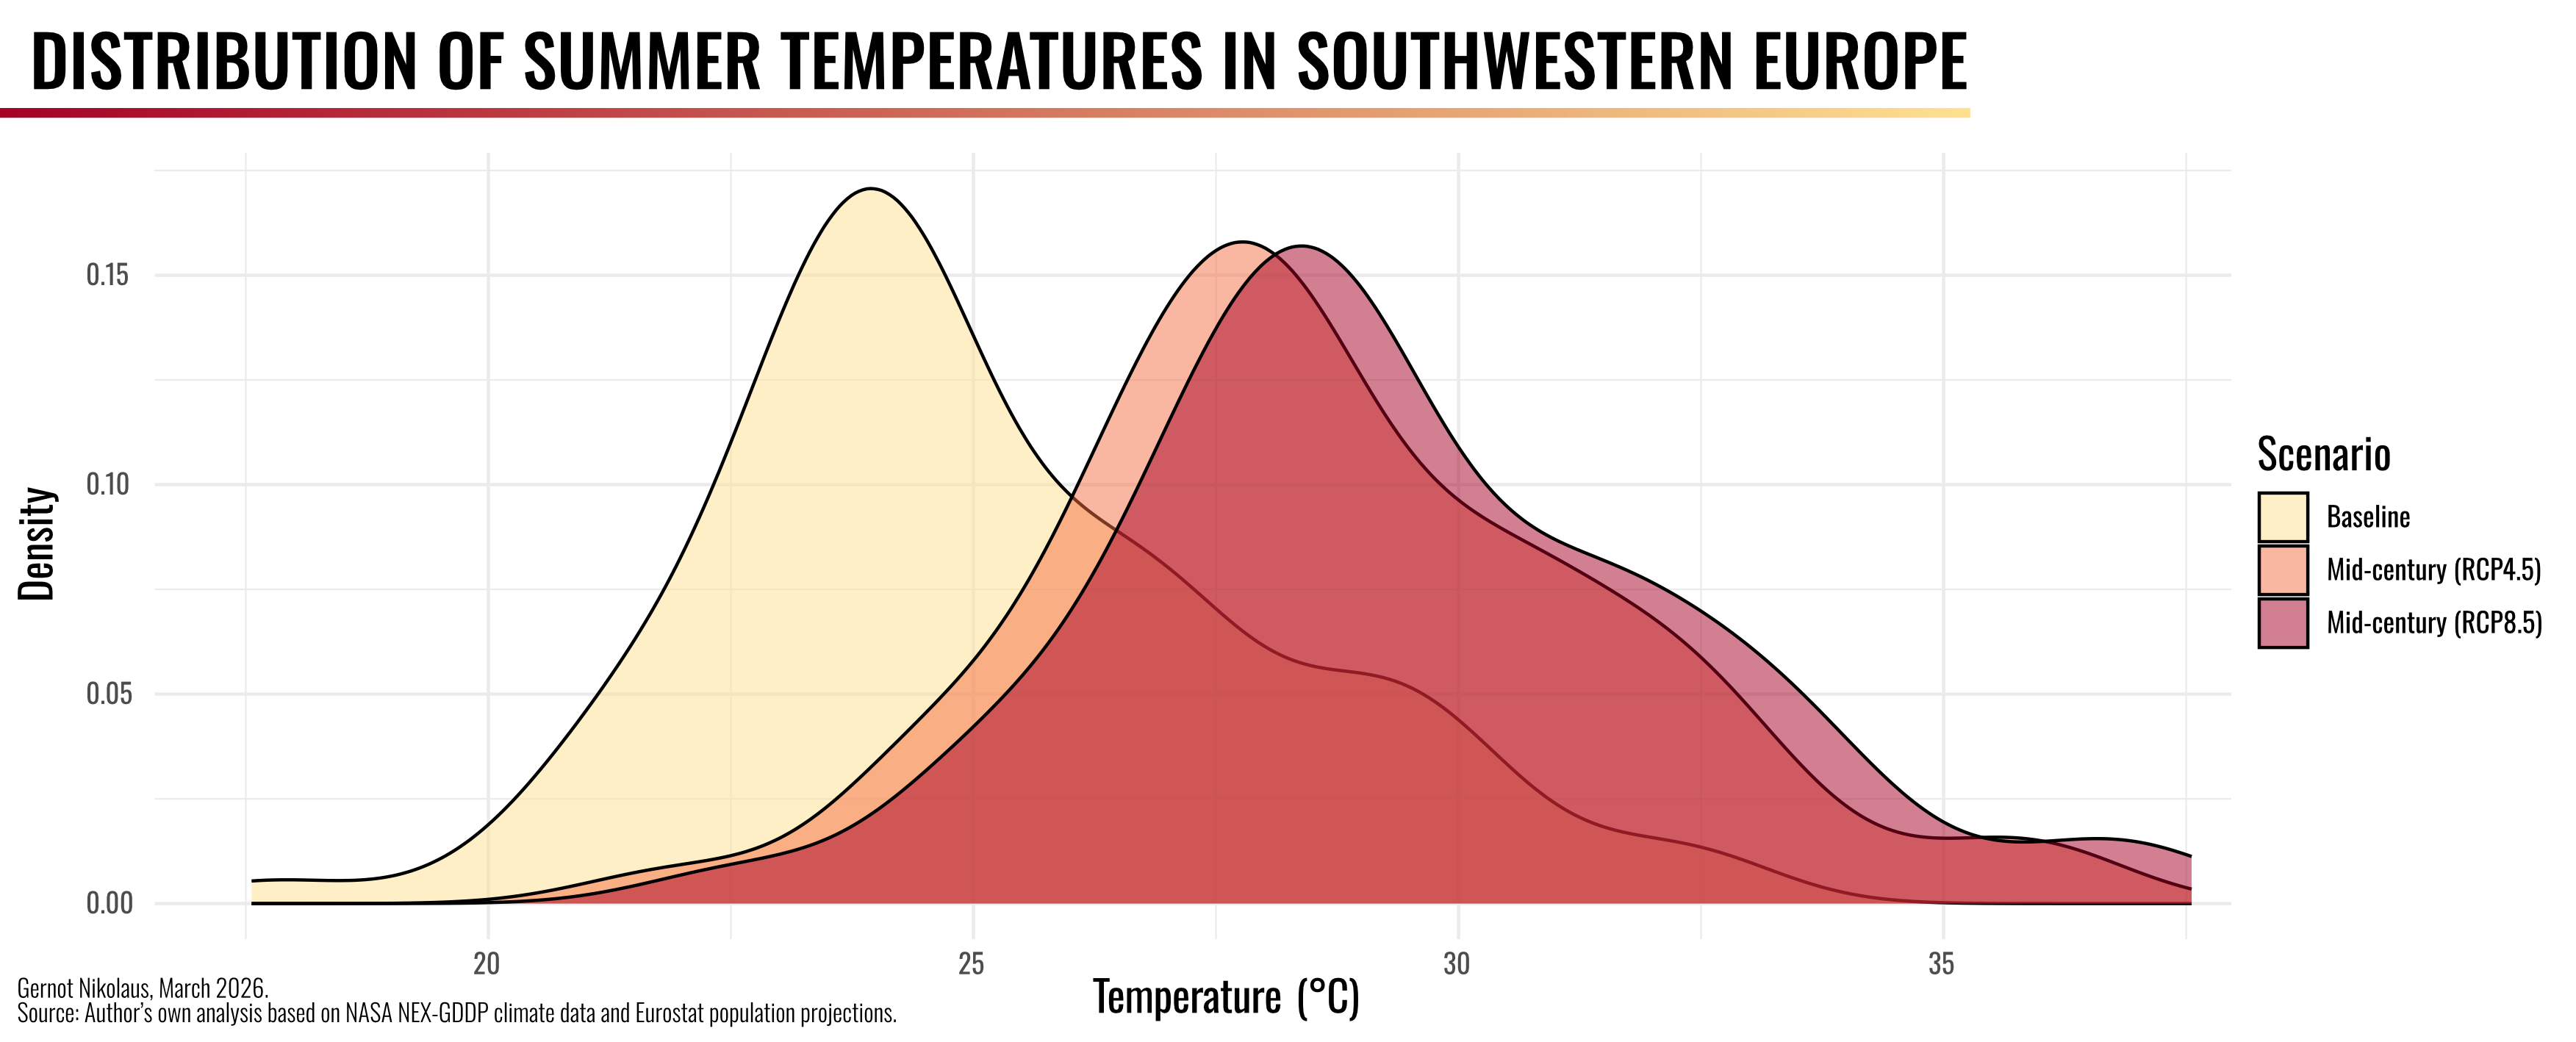
Figure 4 shows the projected share of elderly populations (65+) for 2025 and 2050. While the elderly share 2025 is quite even in the countries, Spain will experience strong growth in the elderly population in northwestern and inland regions. Regions such as Zamora, León, and Asturias are projected to see elderly shares rise to 43–47%. Portugal shows moderate increases in elderly share, while France remains comparatively stable (Table 1).
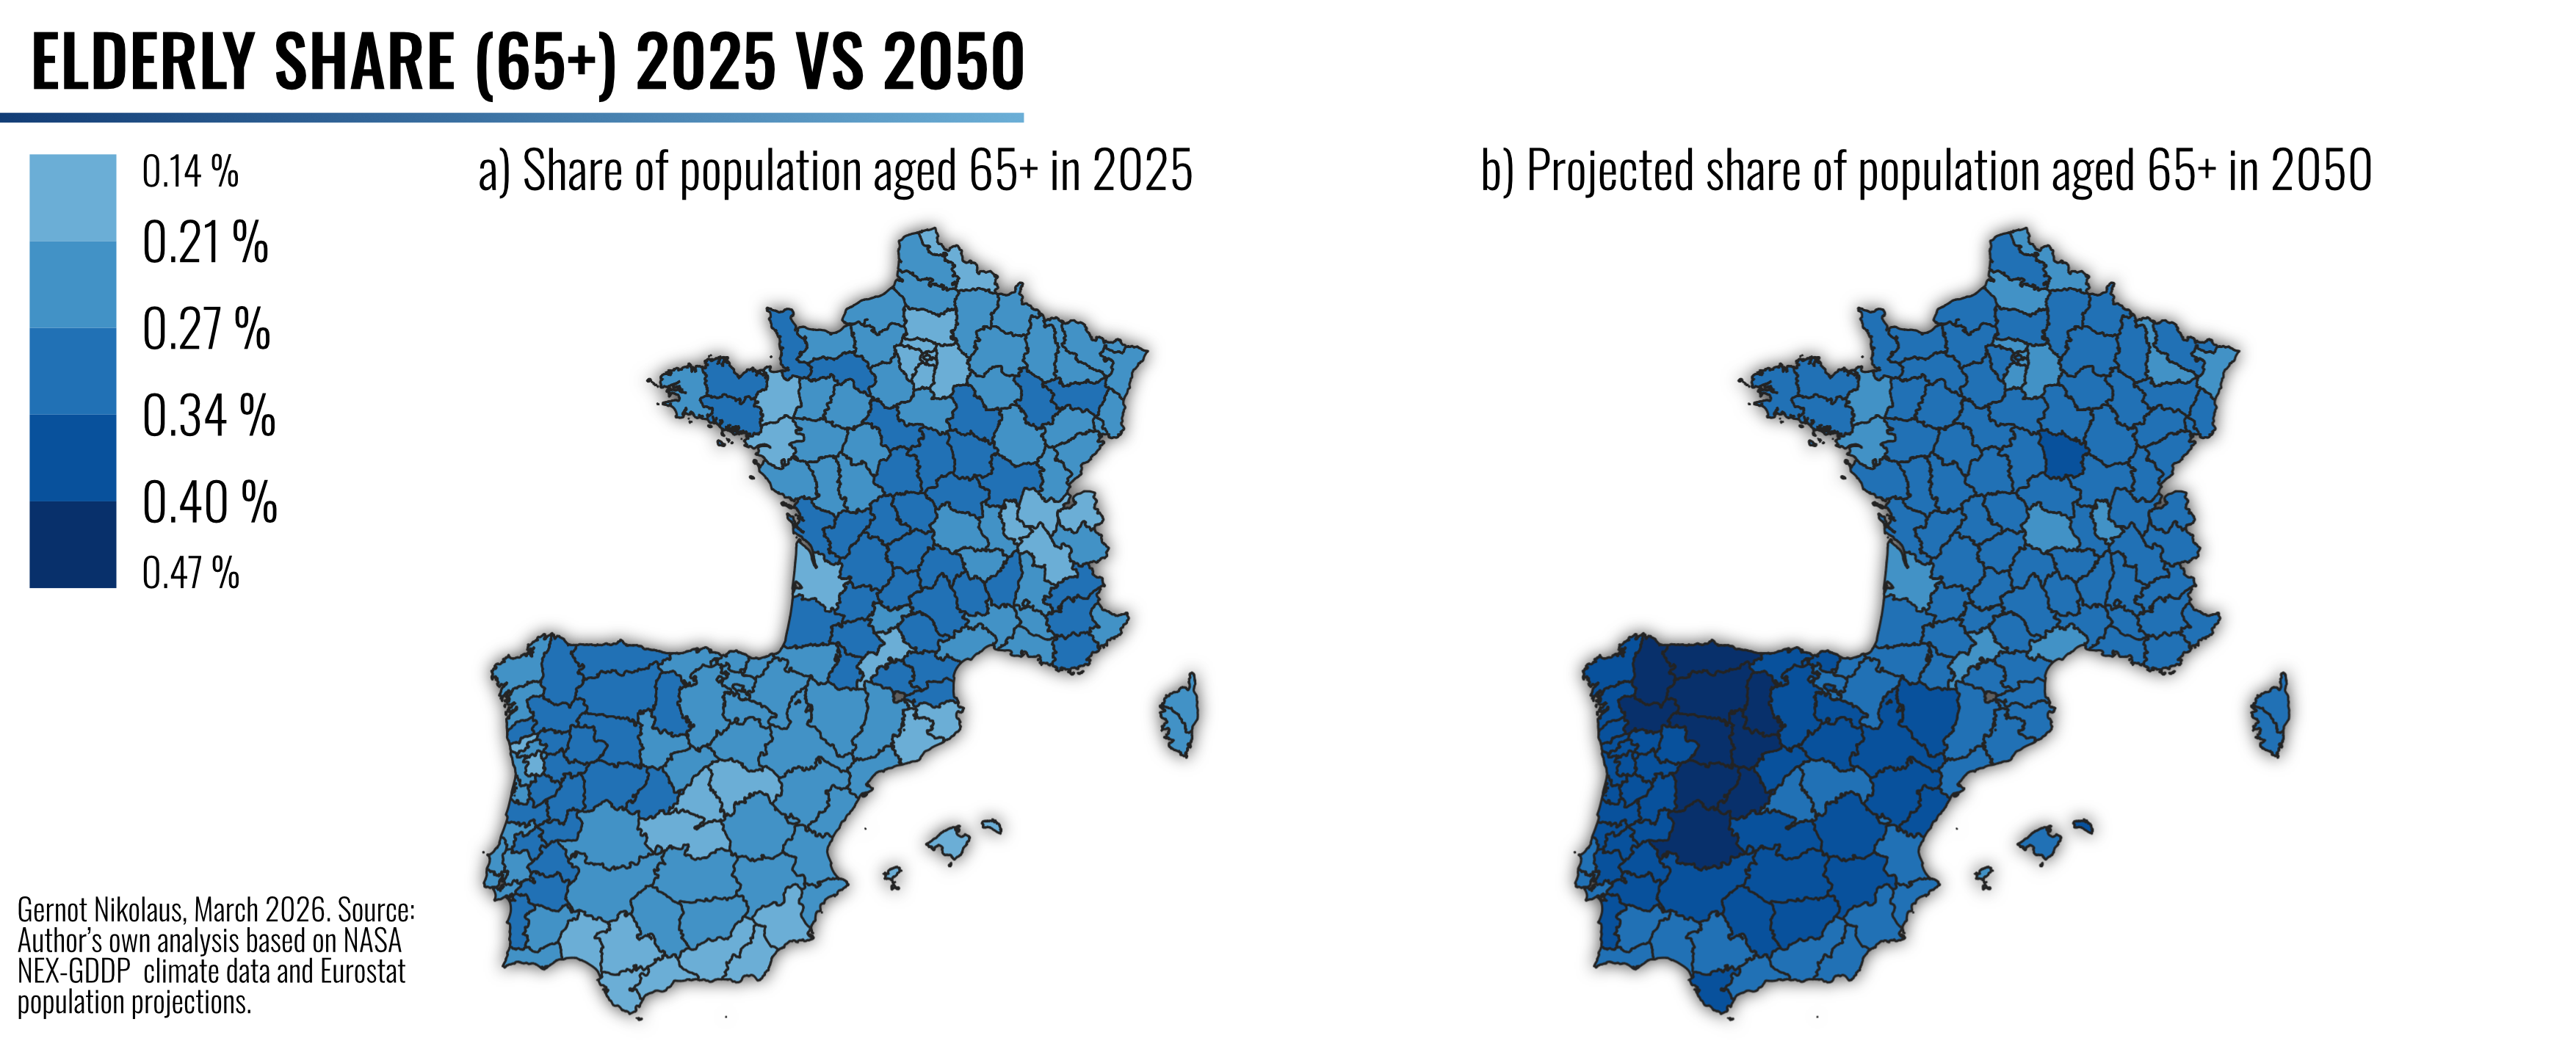
Figure 5 shows elderly population shares. The overall trend is a clear rightward shift across all three countries, indicating that older individuals will represent a much larger portion of the total population by 2050. While France and Spain have higher density peaks in 2050, Spain is more varied across regions.
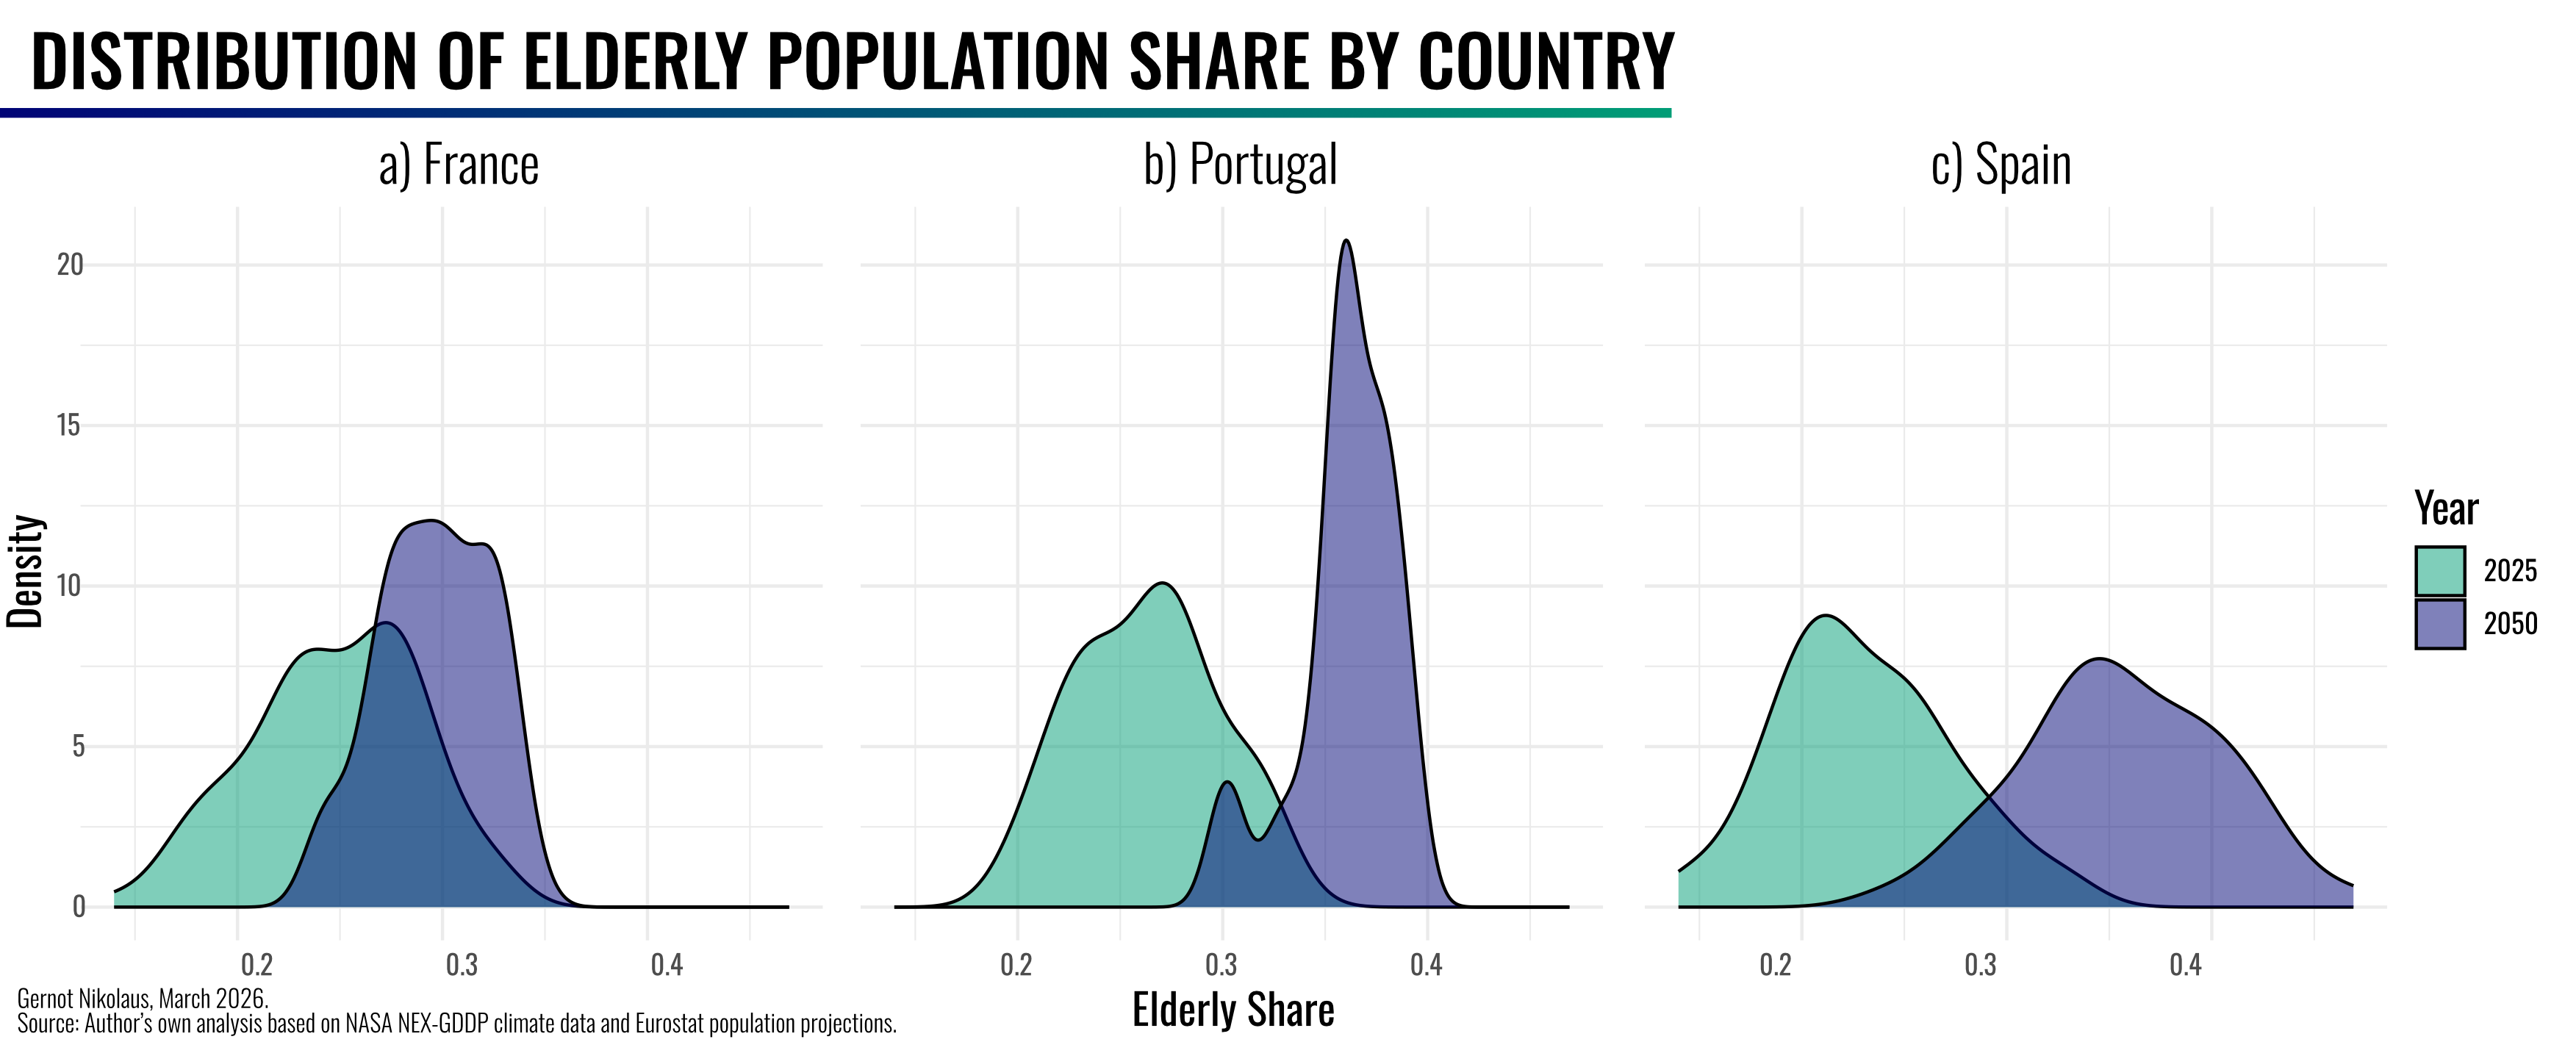
Figure 6 shows a bivariate map, combining temperature increase (ΔT, RCP8.5, 2041–2060 vs. baseline) and projected elderly share (2050). The map reveales regions of highest combined exposure. Spain’s inland provinces, such as Zamora, Cáceres, and Ciudad Real, have the highest combined exposure due to both high temperatures and a large proportion of elderly residents. Portugal displays moderate exposure, where a relatively high baseline temperatures is combined with demographic aging. Despite more moderate temperature increases, relatively high baseline temperatures mean that heat exposure may already be significant in Portuguese regions. In contrast, French regions experience significant warming but lower elderly shares.
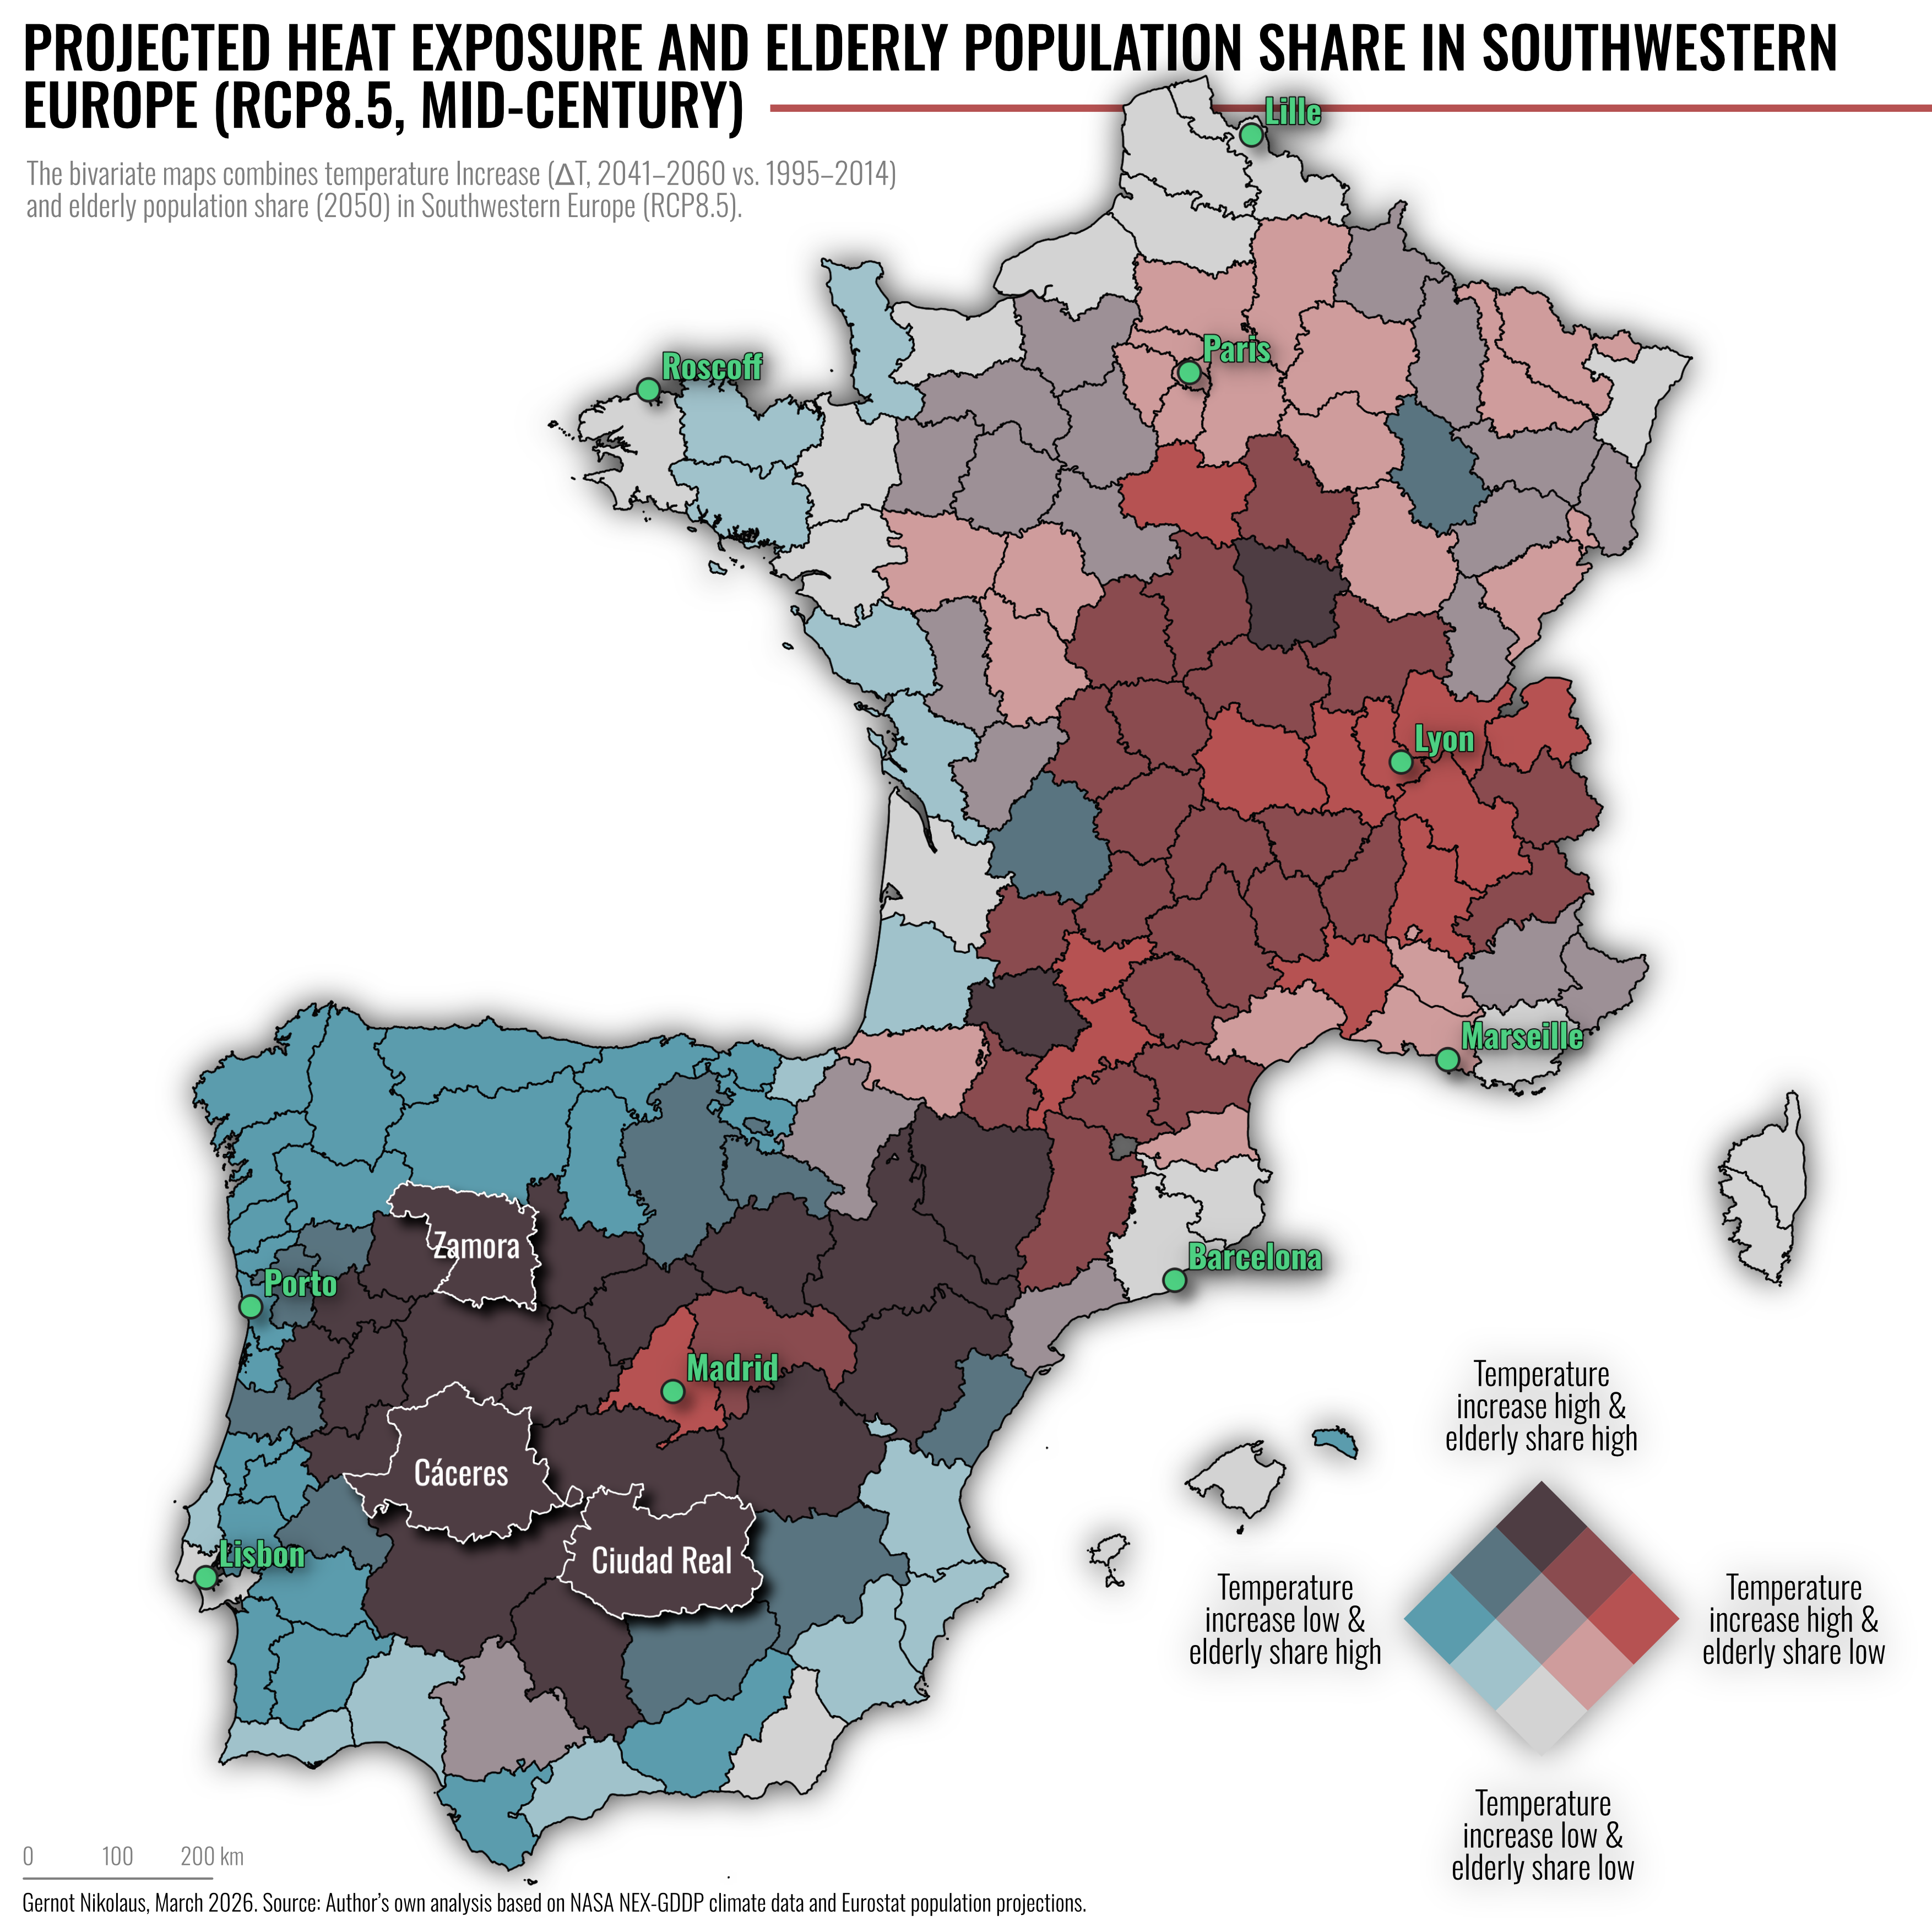
Some regions with the highest combined exposure are not in the highest class of individual variables, reflecting the additive effect of simultaneously elevated temperature and elderly population share.
Table 1 lists the top 20 NUTS3 regions by combined exposure, highlighting Spain’s dominance in regions most at risk. The combined exposure indicator was calculated by normalizing projected summer temperature (RCP8.5) and elderly population share (2050) to a 0–1 scale and summing both variables. The combined exposure indicator represents relative exposure within the study area and does not account for adaptive capacity, urban heat effects, or socioeconomic vulnerability. Only the top 20 regions are displayed here for clarity. The full dataset includes 170 NUTS3 regions across Portugal, Spain, and France.
The results show a spatial concentration of heat-related demographic exposure in Southwestern Europe. Inland Spain is the most vulnerable region, where high temperature increases along with rapidly aging populations. Portugal shows moderate but consistent exposure patterns, particularly in Alentejo and interior regions. In contrast, French regions experience significant warming but lower demographic pressure from aging. The findings highlight the importance of considering both climatic and demographic factors when assessing future heat risk. Future work could include incorporating urban heat island effects, socioeconomic vulnerability, and uncertainty analysis across climate models.
| NUTS Name | Country | Elderly 2025 (%) | Elderly 2050 (%) | Temperature base (°C) | Temperature RCP4.5 (°C) | Temperatur RCP8.5 (°C) | ΔT RCP4.5 | ΔT RCP8.5 | Exposure combined |
|---|---|---|---|---|---|---|---|---|---|
| Zamora | ES | 0.33 | 0.47 | 26.97 | 30.84 | 31.65 | 3.87 | 4.68 | 1.61 |
| Cáceres | ES | 0.26 | 0.40 | 30.50 | 34.64 | 35.69 | 4.14 | 5.19 | 1.59 |
| Ciudad Real | ES | 0.23 | 0.39 | 31.83 | 35.76 | 36.82 | 3.93 | 4.99 | 1.59 |
| Córdoba | ES | 0.22 | 0.36 | 32.84 | 36.56 | 37.56 | 3.72 | 4.72 | 1.52 |
| Badajoz | ES | 0.22 | 0.36 | 32.02 | 35.97 | 37.00 | 3.95 | 4.98 | 1.51 |
| Jaén | ES | 0.22 | 0.36 | 32.37 | 35.86 | 36.82 | 3.49 | 4.44 | 1.49 |
| Salamanca | ES | 0.29 | 0.42 | 27.65 | 31.84 | 32.81 | 4.20 | 5.17 | 1.48 |
| Alto Alentejo | PT | 0.29 | 0.39 | 29.58 | 33.19 | 33.95 | 3.60 | 4.37 | 1.40 |
| Cuenca | ES | 0.24 | 0.38 | 29.34 | 33.19 | 34.11 | 3.85 | 4.77 | 1.39 |
| Toledo | ES | 0.20 | 0.35 | 30.97 | 35.11 | 36.15 | 4.14 | 5.18 | 1.38 |
| Alentejo Central | PT | 0.28 | 0.39 | 29.22 | 32.55 | 33.22 | 3.32 | 4.00 | 1.37 |
| Ávila | ES | 0.28 | 0.41 | 26.21 | 30.41 | 31.40 | 4.20 | 5.19 | 1.36 |
| Albacete | ES | 0.21 | 0.37 | 30.23 | 33.57 | 34.45 | 3.34 | 4.22 | 1.35 |
| Sevilla | ES | 0.19 | 0.33 | 32.50 | 35.94 | 36.78 | 3.44 | 4.29 | 1.35 |
| Beira Baixa | PT | 0.31 | 0.38 | 28.70 | 32.51 | 33.34 | 3.81 | 4.64 | 1.35 |
| Valladolid | ES | 0.26 | 0.40 | 27.23 | 31.13 | 31.95 | 3.90 | 4.71 | 1.34 |
| Beiras e Serra da Estrela | PT | 0.31 | 0.39 | 26.78 | 30.70 | 31.57 | 3.92 | 4.79 | 1.27 |
| Terras de Trás-os-Montes | PT | 0.32 | 0.38 | 27.15 | 31.03 | 31.87 | 3.87 | 4.72 | 1.23 |
| Soria | ES | 0.27 | 0.39 | 26.43 | 30.33 | 31.19 | 3.91 | 4.77 | 1.22 |
| Segovia | ES | 0.25 | 0.39 | 26.13 | 30.24 | 31.15 | 4.11 | 5.02 | 1.22 |
[1] https://climate.copernicus.eu/major-heatwave-southwestern-europe-during-third-warmest-august-record
[2] Thrasher, B., et al. (2012). “Technical Note: Bias correcting climate model simulated daily temperature extremes with quantile mapping,” Hydrology and Earth System Sciences, 16(9), 3309-3314
[3] https://doi.org/10.2908/PROJ_19RP3 [accessed: 28.03.2026]
This study is intended for academic purposes only. It has not been peer-reviewed, and no formal uncertainty analysis was performed.