30DayMapChallenge
November 01, 2025
The 30DayMapChallenge consists of 30 different mapping themes and takes place every November. I participated to some extent this year, creating maps for certain themes as time permitted.
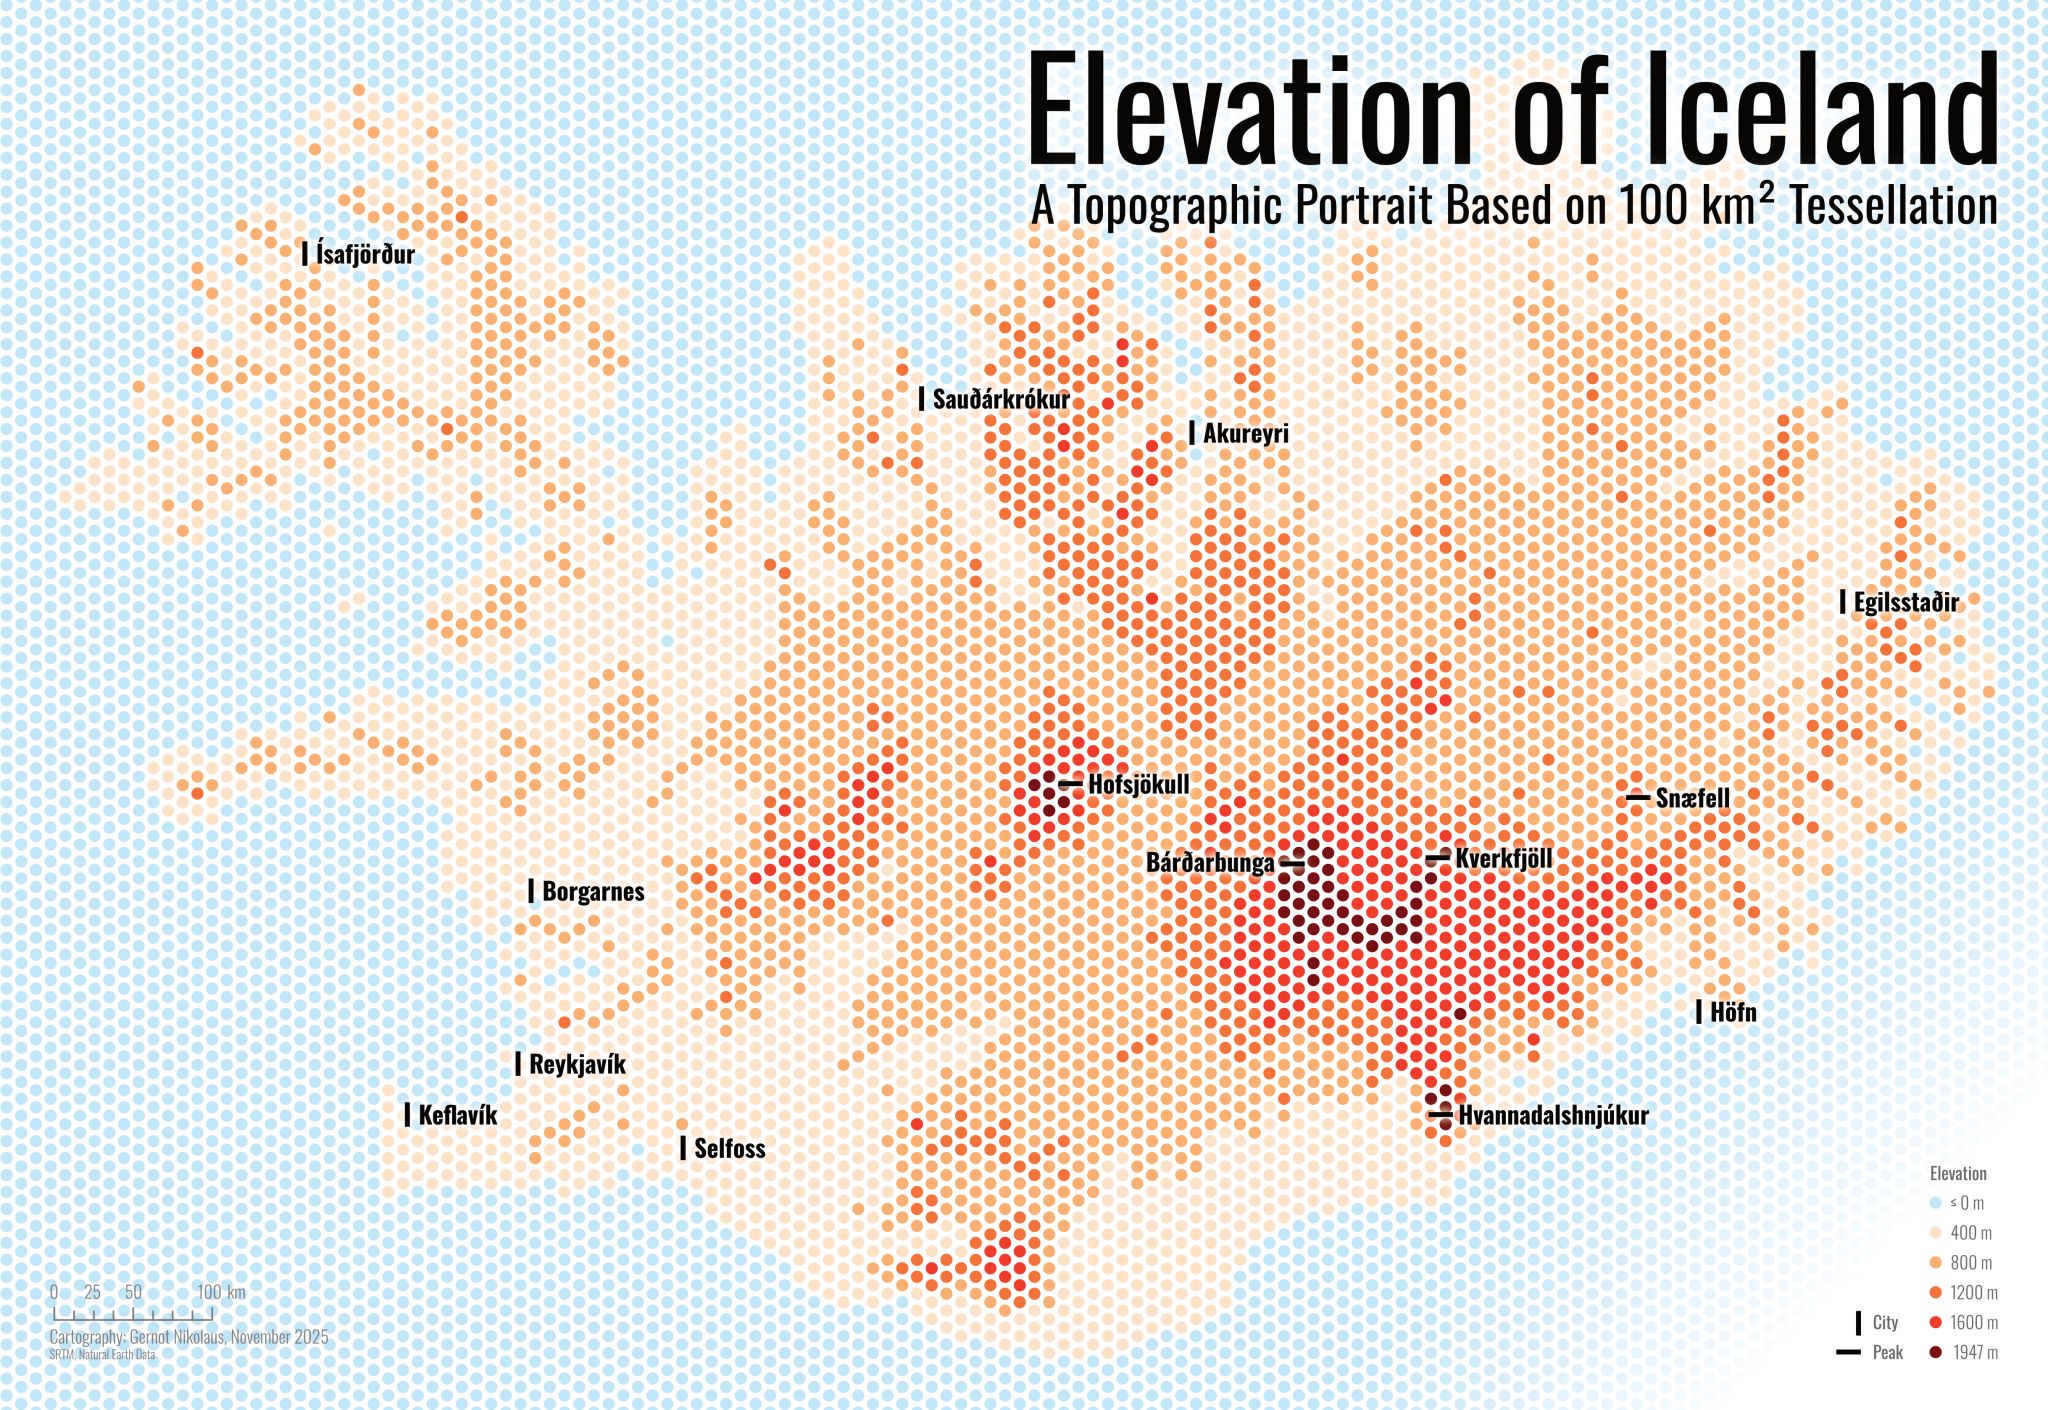
Topic 01: Points 🗺️ Elevation of Iceland
Just came back from 4 months of traveling, and I totally missed that the new #30DayMapChallenge starts today! To kick things off for Day 1, #Points, I quickly threw together a map visualizing the elevation of Iceland - experimenting with an approach that maps the average elevation across 100 km² areas using SRTM data.
processing in ArcGIS Pro, layout in Affinity Designer generate tessellation points - extract SRTM values - symbology - design
Topic 02: Lines 🗺️ Global Tropical Cyclone Tracks and Landfalls (1980-2019)
Today’s map for Day 2, #Lines, of the #30DayMapChallenge visualizes Global Tropical Cyclone Tracks and Landfalls (1980-2019). Using the NOAA IBTrACS dataset, each line traces the path of a tropical cyclone, colored by wind intensity according to the Saffir–Simpson Scale, while points mark the first landfall of each storm.
processing in ArcGIS Pro, layout in Affinity Designer filtered data - converted 10-min winds to 1-min winds - categorized + symbolized - intersected paths with land - summary statistics + join to extract first landfall points - symbolized - design

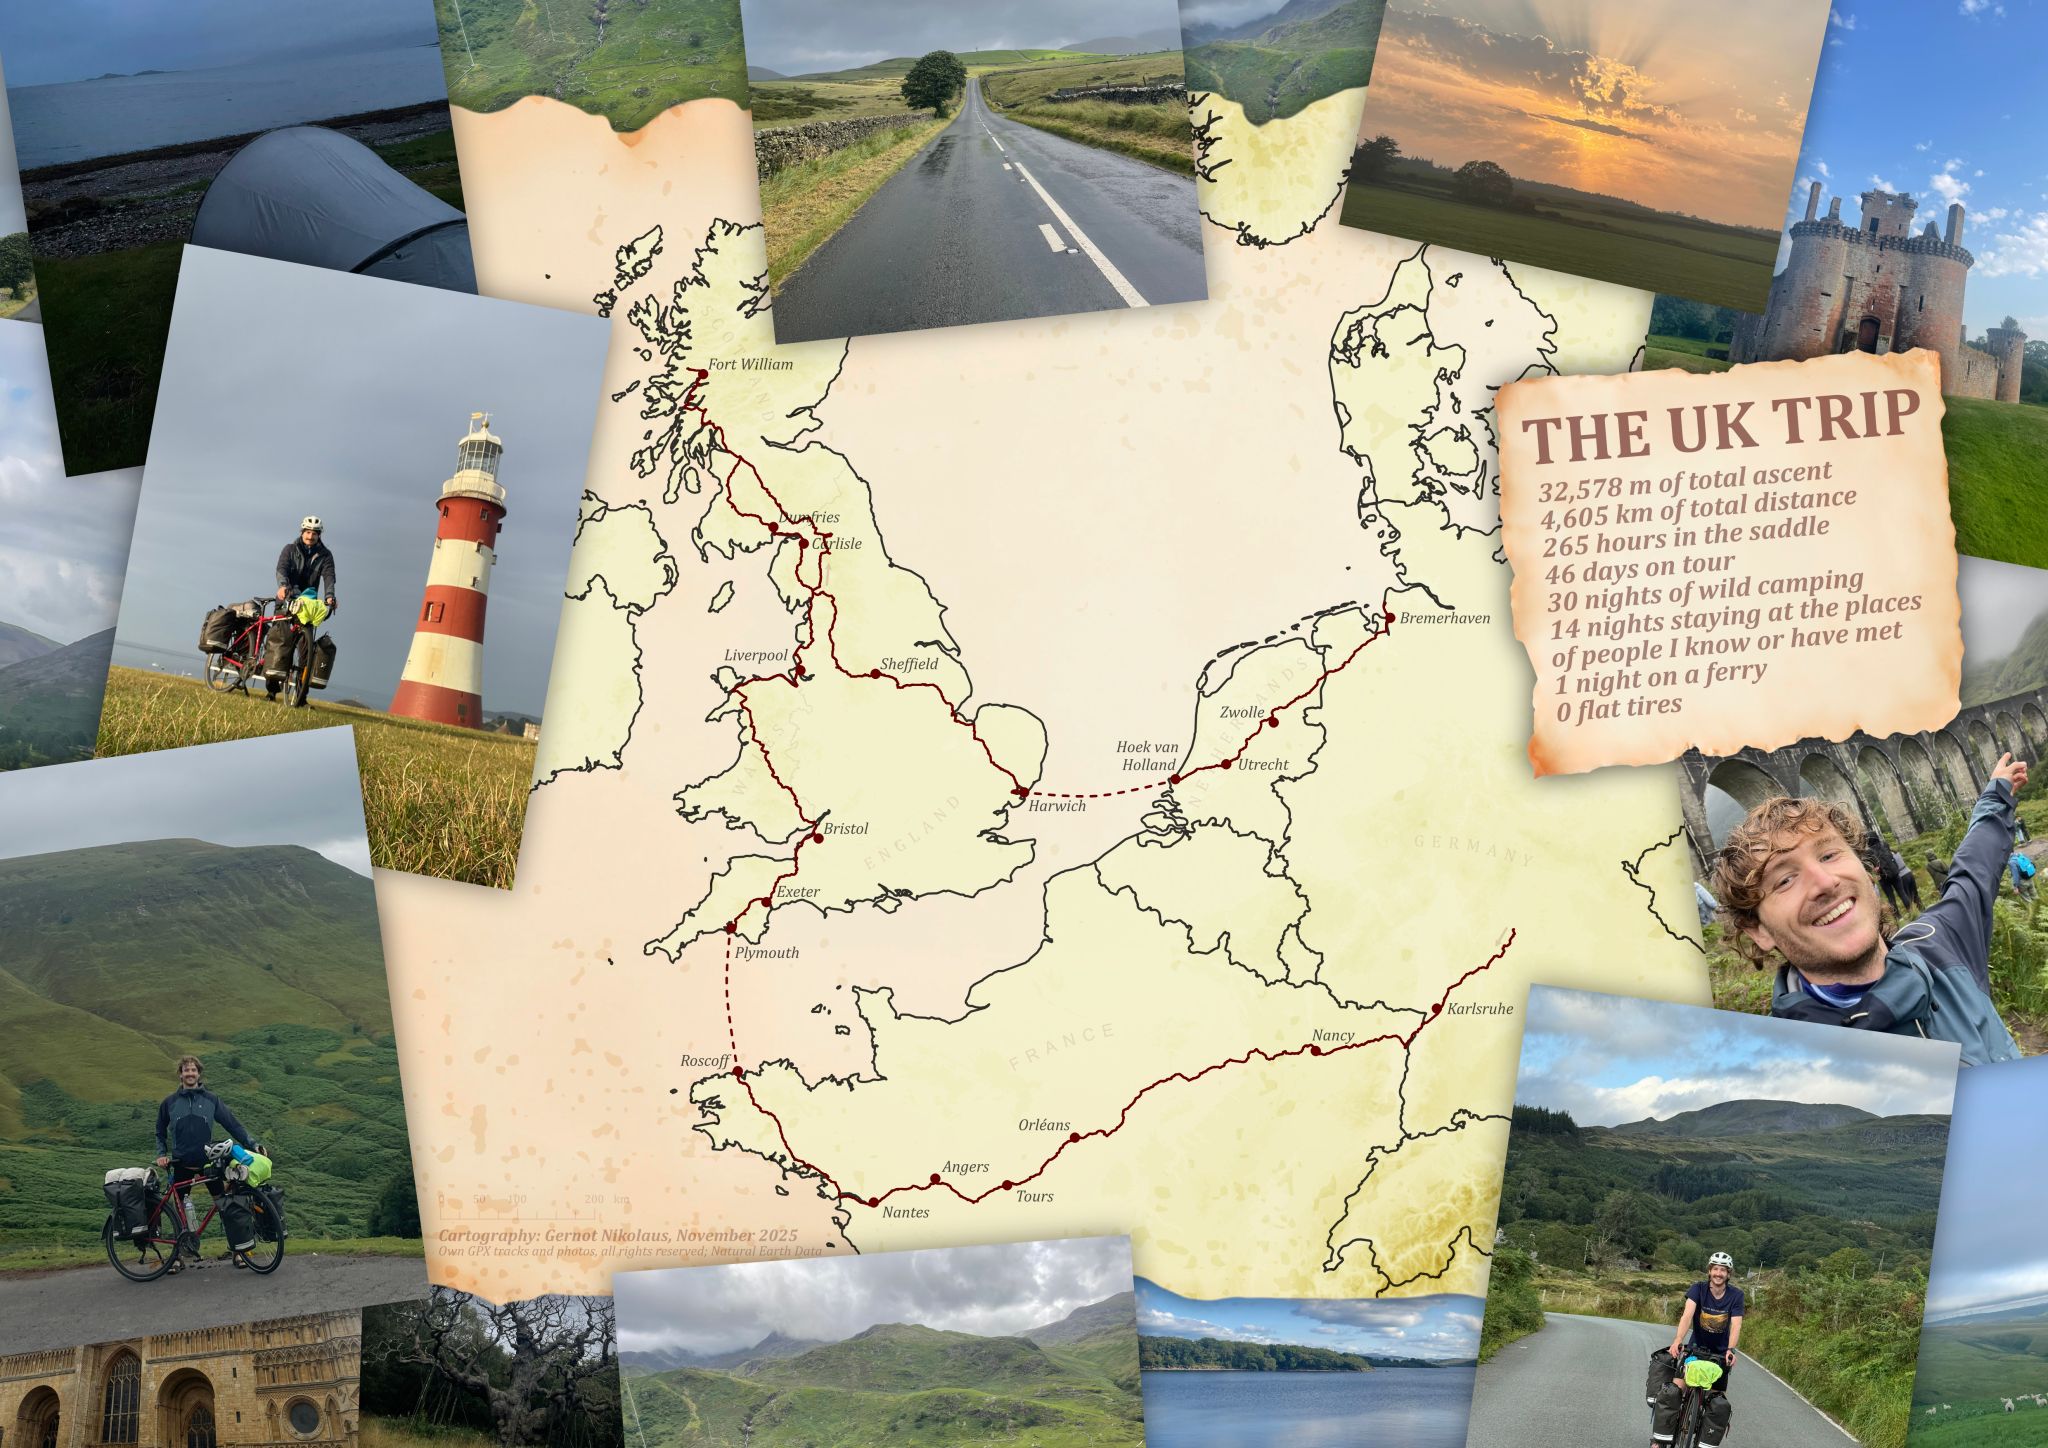
Topic 04: My Data 🗺️ The UK Trip
In July and August I went on a long-distance solo cycling trip through most of the UK - starting in Germany and back again. What data could suit Day 4, #MyData, of the #30DayMapChallenge better than my own GPX tracks? Cycling nearly 5000 km and camping most nights out in nature, passing places like Dartmoor, Snowdonia, and the Glenfinnan Viaduct.
Germany - France - England - Wales - England - Scotland - England - the Netherlands - Germany
quick processing in ArcGIS Pro, everything else in Affinity Designer and Photo cycling - merge gpx tracks - design